Deviation

Compute the deviation between point clouds and geometric shapes with heat map and numeric values.
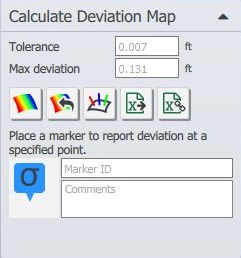
Deviation Analysis
By comparing one object to another you can create a detailed color map indicating the variance. Valid targets are point cloud, lines, points, planes, cylinders, and imported CAD data. The Tolerance defines the lower limit of deviation, all points closer then this value are ignored. The\ Max Deviation value defines the upper limit of deviation, all points greater then this value are ignored.
To modify deviation color ramp, please see section |
Deviation with CAD Deviation using lines Deviation using points |

Created with the Standard Edition of HelpNDoc: Free EBook and documentation generator